K Nearest Neighbors
09 Dec 2017Objective: This blog introduces a supervised learning algorithm called K-nearest-neighbors (KNN) followed by application on regression and classification on iris-flower dataset. All code are written in python from scratch with comparable result using high level scikit-learn machine learning library.
Content:
1. Introduction
The KNN algorithm is a simple, robust and versatile classifier in supervised learning algorithm toolbox. In spite of its simplicity, KNN can outperform more powerful classifiers in some specific applications. The name ‘nearest neighbors’ reveals some facts about the algorithm, that is, prediction is made based on their neighbors aka vectors that are close to it in high dimensional space.
That ‘close neighbors’ is determined by the distance between unlabeled data to labeled data. How distance is measured and how their neighbors determines label of data will be discussed in next part.
2. KNN methodology
2.1. Unsupervised learning recap
KNN is one of the supervised learning algorithm, this means that we are given a labeled dataset containing training observations \((\mathbf{x^i},y^i)\) where \(\mathbf{x^i}\) is a vectors, training data containing features of data and \(y\) is label of training example \(\mathbf{x^i}\), normally, \(y^i\) is a number representing the category where the training example belonged to. Our goal is to find the relationship between \(\mathbf{x^i}\) and \(y^i\) or learn a function \(h:X \rightarrow Y\) so that given an unlabeled observation \(\mathbf{x}\), \(h(x)\) can predict the corresponding output \(y\).
2.2. KNN characteristics: Non-parametric, instance-based, lazy learning.
Non-parametric:
A learning model that summarizes data with a set of parameters of fixed size (independent of the number of training examples) is called a parametric model. No matter ho much data you throw at a parametric model, it won’t change its mind about how many parameters it needs. [1]
Nonparametric methods do not make strong assumptions about the form of the mapping function. By not making assumption, they are free to learn any functional form from the training data.
Nonparametric methods are good when you have a lot of data and no prior knowledge, and when you don’t want to worry too much about choosing just the right feature [1]
Instance-based:
KNN doesn’t explicitly learn a fixed model. Instead, it memorizes all the training instances then use them as knowledge to make prediction. In KNN, predictions are made individually, for each test data, KNN loops through all training set, calculates the distances between the test data we are trying to predict and every single data in training set then choose the appropriate label based on K nearest data point to the test data.
Lazy learning:
Because of predicting test data individually by going through the whole training set, KNN doesn’t learn anything. Training time is 0, all predictions are made in testing time. This is not very desirable, we normally want to optimize performance time (test time).
2.3. Distance and weight
Distance: There are several choices when it comes to distances, how we could measure the distance between test data and training data?
There are several options: Euclidean, Hamming, Manhattan, Minkowski, Tanimoto, Jaccard, Mahalanobis, etc.
Weight: Similar to weight in a neural network model, weights are used so that different data points will have different affects on the test data. In KNN, it makes sense if we increase the weight of training data points which are closer to test data point.
2.4. Algorithm
Suppose we have a training set consisting \(n\) training observations \((\mathbf{x^i},y^i)\) for \(i \in [1,n]\). Our goal is to predict label \(y\) of unlabeled observation \(\mathbf{x}\)
Step 1:
Calculate \(n\) distances between \(\mathbf{x}\) to every single training example. A popular choice is Euclidean distance given by:
\begin{equation} \tag{1}\label{eq:1} d(\mathbf{x}, \mathbf{x^i}) = ||\mathbf{x} - \mathbf{x^i}||^2_2 = \sqrt{(\mathbf{x_1}-\mathbf{x^i_1})^2+…(\mathbf{x_m}-\mathbf{x^i_m})^2} \end{equation}
\(\mathbf{m}\) is the number of features (or dimensions) of vector \(\mathbf{x}\).
Step 2: Choose \(K\), the number of neighbors to have an affects on label of \(\mathbf{x}\). Call \(A\) as the set of \(K\) points that are closest to \(\mathbf{x}\) based on the distances we have calculated in step 1.
Step 3:
Calculate conditional probability for each class.
\begin{equation} \tag{2}\label{eq:2} P(y=j|X=\mathbf{x}) = \frac{1}{K} \sum_{i \in A}I(y^{(i)}=j) \end{equation}
\(I(x)\) = 0 when statement \(x\) is false and 1 when statement \(x\) is true.
\(P(y=j \mid X=\mathbf{x})\): Probability of \(y\) (label of \(\mathbf{x}\)) to be \(j\) given test data \(\mathbf{x}\).
Step 4:
Finally, our input \(\mathbf{x}\) gets assigned to the class with the largest probability.
To recap, the label of test data is the most common label around it.
In the algorithm above, we use ‘uniform’ weight, we treat every neighbor equally no matter how close it is to \(\mathbf{x}\). However we can use ‘distance’ weight: The distance to \(\mathbf{x}\) will also be taken into account.
The following weight function could be use: \begin{equation} \tag{3}\label{eq:3} w_i = exp(\frac{-||\mathbf{x}-\mathbf{x^i}||^2_2}{\lambda ^2}) \end{equation}
That weight function will let data points which are closer \(\mathbf{x}\) have more effects on the output \(y\). By adding different weights to neighbors of \(\mathbf{x}\), the conditional probability in \(\eqref{eq:2}\) becomes:
\begin{equation} \tag{4}\label{eq:4} P(y=j|X=\mathbf{x}) = \frac{1}{K} w_i \sum_{i \in A}I(y^{(i)}=j) \end{equation}
3. Application with python
3.1. Regression
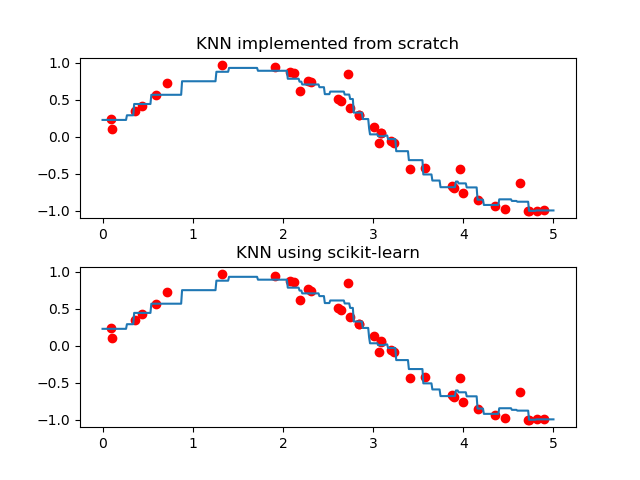
In this apart, I will generate sample point on 2D plane and perform KNN to do regression. In this part, euclidean distance function is used and weight=’uniform’ (means all neighbors are treated the same). Script is written from scratch, at the end, I will use scikit-learn library to compare the result.
import numpy as np
import matplotlib.pyplot as plt
import copy
from bisect import bisect_left
from sklearn import neighbors

#########################################################
"""
Additional funtions for KNN
"""
def takeClosest(myList, myNumber):
	"""
	Assumes myList is sorted. Returns closest value to myNumber.
	If two numbers are equally close, return the smallest number.
	"""
	pos = bisect_left(myList, myNumber)
	if pos == 0:
		return myList[0]
	if pos == len(myList):
		return myList[-1]
	before = myList[pos - 1]
	after = myList[pos]
	if after - myNumber < myNumber - before:
		return after
	else:
		return before

def takeKClosest(myList, myNumber,k):
	"""
	Assumes myList is sorted. Returns closest value to myNumber
	Return a list of k numbers from myList that are closest to myNumber
	"""
	myListCopy = copy.deepcopy(myList) # myList will be manipulated a copy is needed
	listNum = [] # list of k numbers closest to myNumber
	for i in range(0,k):
		"""
		Algorithm: Find a closest number to k then remove that number from myListCopy
		"""
		closestNum = takeClosest(myListCopy, myNumber)
		listNum.append(closestNum)
		del myListCopy[myListCopy.index(closestNum)]
	return listNum

def takeKClosestIdx(myList, myNumber, k):
	"""
	Get the index of k closest numbers to myNumber
	"""
	closestNums = takeKClosest(myList, myNumber, k)
	listIdx = []
	for i in closestNums:
		listIdx.append(myList.index(i)) # index() function looks up index of number in list
	return listIdx

#########################################################
# Generate sample data
np.random.seed(0) # Get one random set of number every time running the program
X = np.sort(5 * np.random.rand(40, 1), axis=0) # generate 40 values in range (0,5)
y = np.sin(X).ravel() # ravel function spread out matrix to a single row

# Add noise to targets
y[::5] += 1 * (0.5 - np.random.rand(8)) #get a random number every 5 steps

# Fit regression model
x0 = np.linspace(0,5,500) # x0 is used to visualize regression model
y0 = [] # our goal is to fill out y0 based on x0
k_neighbors = 3


# treat every data uniformly, calculate means of k nearest value to each element in x0
for i in x0:
	listIdx = takeKClosestIdx(X.ravel().tolist(), i, k_neighbors) # .ravel().tolist() transform numpy array to list
	sumY = 0
	for j in listIdx:
		sumY += y[j]
	y0.append(sumY/k_neighbors)

# Plot graph
plt.figure(1)
plt.subplot(211) # first graph of figure 1
plt.title("KNN implemented from scratch")
plt.plot(X,y,'ro') # plot data
plt.plot(x0,y0)		 # plot regression model
plt.subplots_adjust(hspace=0.3) #adjust space between 2 graphs

# Second graph using scikit-learn
plt.subplot(212) # second graph of figure 1
plt.title("KNN using scikit-learn")
for i, weights in enumerate(['uniform']):
	knn = neighbors.KNeighborsRegressor(k_neighbors, weights=weights)
	y0 = knn.fit(X, y).predict(x0[:, np.newaxis])
	plt.plot(X, y, 'ro')
	plt.plot(x0, y0)

plt.show()
3.2. Classification
In this part, we perform KNN on iris flower dataset to classify 3 types of iris flowers:
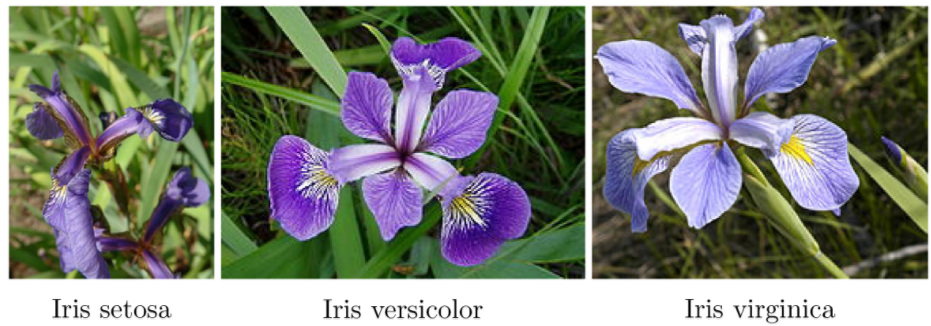
The dataset consists of 150 sample data (5 features: Petal Length , Petal Width , Sepal Length , Sepal width) with label (0,1,2) corresponding to 3 types of flowers. We will split 150 example to training set (100 samples) and test set (50 samples). Accuracy of the classifier that we will build can go up to 96%-100%.
import numpy as np
import matplotlib.pyplot as plt
import random
from sklearn import neighbors, datasets
from sklearn.metrics import accuracy_score
import math
import operator

#########################################################
"""
Additional funtions for KNN
"""
def euclideanDistance(vector1, vector2):
	"""
	Calculate euclideanDistance of 2 vectors (in a list format)
	"""
	if vector1.shape != vector2.shape:
		raise ValueError('Two vector not in same length')

	length = len(vector1)
	distance = 0
	for x in range(length):
		distance += pow((vector1[x] - vector2[x]), 2)

	return math.sqrt(distance)

def getKNeighbors(trainingSet, trainingSetLabel, testInstance, k):
	"""
	Return the list of k nearest neighbors label
	"""
	neighbors = []

	distances = []
	for i in range(0,len(trainingSetLabel)):
		distances.append((euclideanDistance(testInstance, trainingSet[i]), trainingSetLabel[i]))
		distances.sort(key=operator.itemgetter(0)) # sort distance based on first element of each tuples in list (euculidean distance)

	for i in range(0,k):
		neighbors.append(distances[i][1]) #Add k nearest neighbors to list

	return neighbors

def getHighestVote(myList):
	"""
	Return most common occurrence item in a list
	"""
	voteDict = {}
	for vote in myList:
		if voteDict.get(vote) == None:
			voteDict[vote] = 1
		else:
			voteDict[vote] += 1

	maxVote = 0
	for key, value in voteDict.items():
		if value > maxVote:
			maxVote = key

	return maxVote

def predictNearestNeighbor(trainingSet, trainingSetLabel, testInstance, k):
	"""
	Return the prediction based on KNN algorithm
	"""
	neighbors = getKNeighbors(trainingSet, trainingSetLabel, testInstance, k)
	return(getHighestVote(neighbors))

def accuracy_score(groundTruth, prediction):
	"""
	Return accuracy score of prediction
	"""
	if len(groundTruth) != len(prediction):
		raise ValueError('Prediction and groundTruth not in same length')

	accuracyCount = 0
	length = len(prediction)
	for i in range(0,length):
		if groundTruth[i] == prediction[i]:
			accuracyCount += 1

	accuracy_score = accuracyCount/length
	return round(accuracy_score,3)


def main():
	# Load iris dataset
	iris = datasets.load_iris()
	iris_X = iris.data # 150 data points, 4 features (Petal Length , Petal Width , Sepal Length , Sepal width)
	iris_y = iris.target # label/class of 150 data points (0,1,2)

	k_neigbors = 5

	# Shuffle data by shuffling the index
	randIndex = np.arange(iris_X.shape[0])
	np.random.shuffle(randIndex)

	iris_X = iris_X[randIndex]
	iris_y = iris_y[randIndex]

	# Split training set/ test set (100/50)
	X_train = iris_X[:100,:]
	X_test = iris_X[100:,:]
	y_train = iris_y[:100]
	y_test = iris_y[100:]

	#apply KNN classifier to each test data
	y_predict = []
	for i in range(0,len(y_test)):
		y_predict.append(predictNearestNeighbor(X_train, y_train, X_test[i], k_neigbors))

	print(accuracy_score(y_predict, y_test)) #output: 0.98

main()
4. Discussion
4.1. Hyperparameter
There are several hyperparameter that we can tweet to find the best solution:
1.K: High \(K\) resulted in more noise-tolerant, it means small \(K\) will make the KNN very sensitive to noise/ outlier.

Small K means more sensitive to noise, resulted in overfitting
2.Distance function
4.2. Speed of execution
Speed of KNN is considered as low because there are no prior knowledge before testing time, KNN doesn’t learn anything during training time.
4.3. Normalization
Normalization (use same scale for all metric data by changing the scale to 0-1). It is quite important in KNN because different scale could cause unbalance to distance. This leads to the situation where large scale data have more impact to the output than low scale data.
5. Reference
[1] Artificial Intelligence: A Modern Approach, page 737, 757
[2] https://machinelearningmastery.com/parametric-and-nonparametric-machine-learning-algorithms/
[3] https://kevinzakka.github.io/2016/07/13/k-nearest-neighbor/
[4] https://en.wikipedia.org/wiki/Iris_flower_data_set
[5] https://machinelearningcoban.com/2017/01/08/knn/
[6] https://www.analyticsvidhya.com/blog/2017/09/30-questions-test-k-nearest-neighbors-algorithm/